Presented toAmerican Copper Council on Fall 1998 Meeting
September 24, 1998
This paper examines the U.S. demand for copper and copper alloy products in the 1990's with additional focus on the supply of these products by brass mills and wire mills as well as the trade flows of copper products. The main thrust of the paper is the historical period from 1990 to 1997 with a brief outlook at 1998 and 1999. Unless otherwise noted, the term copper will be used to refer to both copper and copper alloy products.
Copper Demand
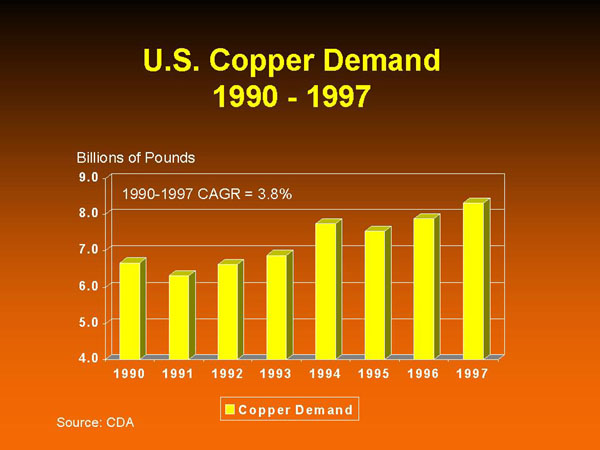
U.S. demand for copper has grown from 6.7 billion pounds in 1990 to 8.3 billion pounds in 1997 for a compound annual growth rate (CAGR) of 3.8%. Copper is benefiting from strength in the U.S. economy, which is now in its seventh year of growth since the 1990-1991 recession. Copper's rate of growth was over 1 1/2 times the rate of real GDP, which has grown at a compound rate of 2.4% over this same time period. Perhaps a better measure of copper's performance over this time period is the manufacturing portion of industrial production, which has grown at a compound rate of 4.1%. 1997 represented the second straight year of record copper consumption, and the first time in history that demand surpassed the 8 billion-pound mark.
In order to understand the growth of copper products we must look at the markets that consume them. While there are a multitude of markets that consume copper, CDA has chosen to combine them into the following five major end use markets:
- transportation products
- building construction;
- electrical & electronic;
- consumer & general products;
- industrial machinery and equipment
As you can see from the table, four out of the five markets have grown faster than real GDP during the 1990's. This paper will discuss those four markets in order of their growth rates. Because some of these markets are quite broad, the market segments composing them will also be listed. As these markets are examined, we will take a look at some of their key drivers.
Transportation Products Market
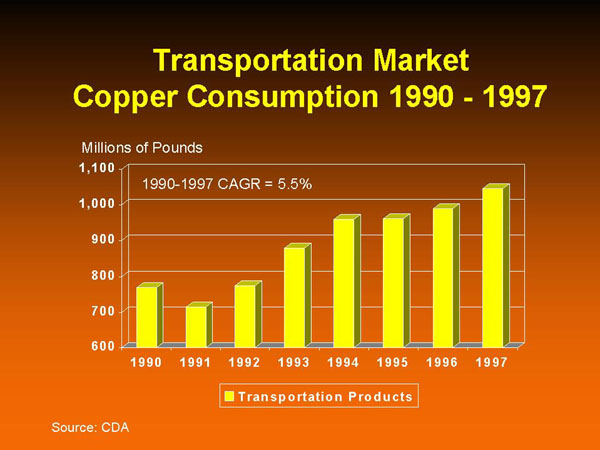
Transportation is the fastest growing market, with a 5.5% compound annual growth rate over the past eight years. It has grown twice as fast as real GDP, from 769 million pounds in 1990 to over one billion pounds in 1997. 1997 marked the first year that this market consumed over one billion pounds of copper products.
This market is composed of the following five market segments:
- automobiles;
- railroad;
- truck & bus;
- aircraft & aerospace;
- marine
The market segments listed here, and for all the markets discussed in this paper, are in order of size. Not all market segments however, are created equal, and the automobile market segment is a case in point. It dominates the transportation market accounting for 90% of the copper consumed.
Automotive Production
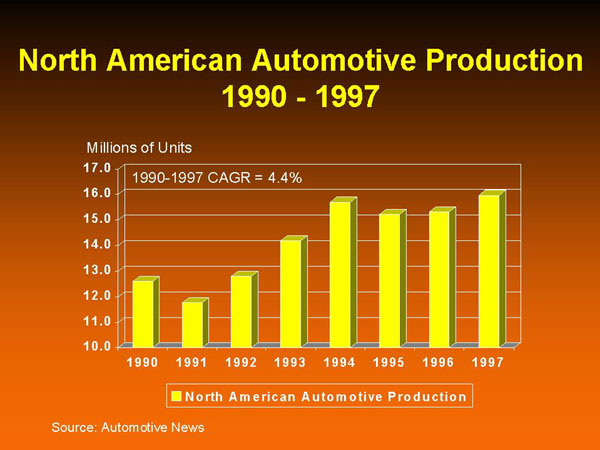
Because of the shear dominance of automotive in the transportation market, the key driver is North American automotive production. Automotive production has grown at a 4.4% compound annual rate over the last eight years, and reached a record 16 million units in 1997. Production by itself however does not account for all the growth in the copper consumed by this market. Another important factor has been the increase in electrical applications in both automobiles and light trucks.
North American Automotive Production
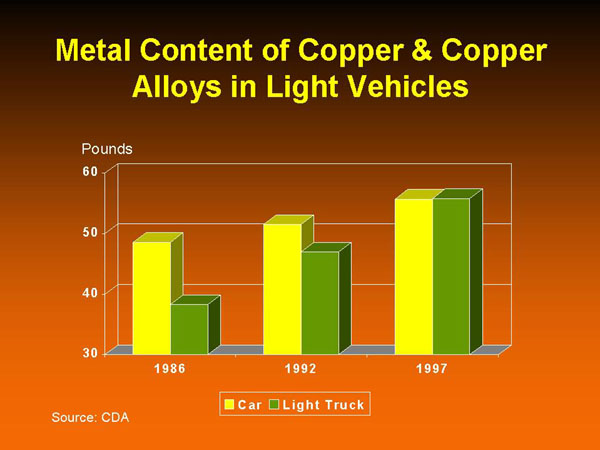
Over the past ten years electrical applications have increased their share of the metal content of copper products from 64% in 1986 to 76% in 1997. One might believe that the driving factor behind this increase is a corresponding decrease in non-electrical applications, due to copper's lost of the radiator. However, during same time period the total amount of copper used in cars and light trucks actually has been increasing. As you can see from the chart below, the average car had approximately 48 pounds of copper and copper alloy products in 1986, while light trucks had only 38 pounds. As light trucks have increased in popularity, so has their number of electrical features. It is not unusual today for vans and suv's to have power seats, power windows, power locks, intermittent wipers, anti-theft devices, and keyless remote entry, just to name a few. This increase in electrical features has enabled light trucks to catch up with cars in terms of copper consumed and both now have approximately 56 pounds of copper products.
Metal Content in Light Vehicles
Building Construction Market
While the transportation market is the fastest growing, the building construction market is by far the largest consumer of copper products, at 3.5 billion pounds and a 41.8% share of the total in 1997. It is over 1 1/2 times the size of the next largest market, electrical and electronic. Building construction is composed of the following market segments:
- building wiring;
- plumbing & heating;
- air conditioning & refrigeration;
- builders' hardware;
- architectural
Although no one segment dominates building construction the way automobiles did the transportation market, the top three segments account for 93% of this markets copper consumption.
Building construction has two key market drivers:
- residential
- nonresidential construction
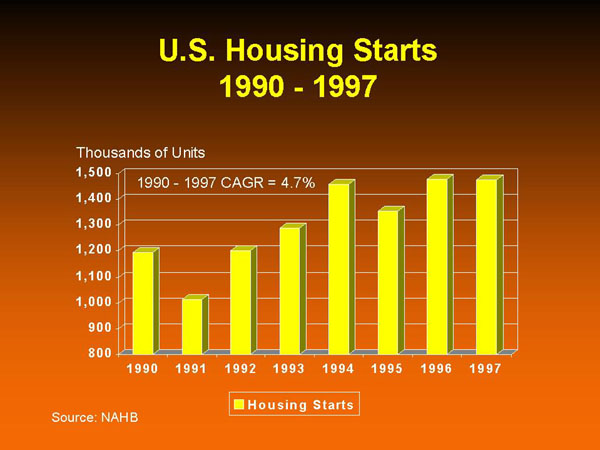
Residential Construction
Residential construction has been benefiting from resurgence in new construction. As you can see from the chart, three out of the last four years have seen housing starts above 1.4 million units. Starts hit a 10-year high in July at 1.7 million units, although they came off that rate in August, with interest rates low and poised to go lower, starts could hit their highest level in 11 years in 1998.
Nonresidential Construction
After the overbuilding period of the 1980's, nonresidential construction was slow to recover. It wasn't until 1994 that nonresidential construction began to take off. The strong economy has helped to reduce vacancy rates, thereby stimulating demand for new offices as well as manufacturing facilities. Construction measured in terms of millions of square feet has now seen three strong years in a row and its best year this decade, with 1.3 billion square feet constructed in 1997.
US Nonresidential Construction Market
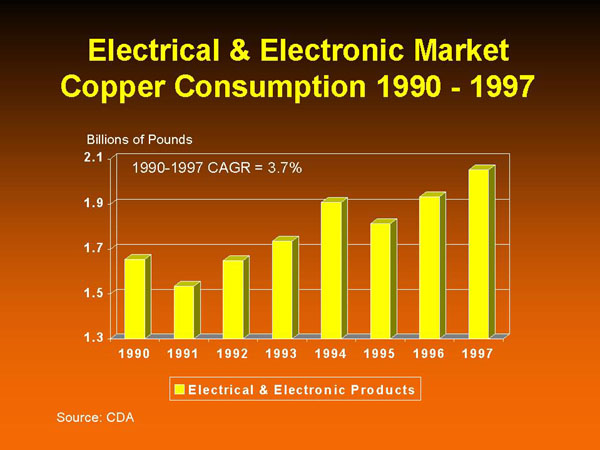
Electrical & Electronic Market
Electrical and electronic is the second largest market for copper products, accounting for almost 25% and over 2 billion pounds of copper consumption in 1997. The 2 billion-pound mark represents record consumption for this market. This market has consumed over 1.9 billion pounds of copper products three out of the last four years. The last time this market consumed that much copper was in 1979. The four market segments that make up this market are:
- power utilities;
- telecommunications;
- business electronics;
- lighting & wiring devices
Electrical & Electronic Market
The top two market segments, power utilities and telecommunications, account for almost two-thirds of the copper it consumed by this market. Unlike the previous two markets discussed, to understand the key driving forces behind this market, we must drill down several levels. A key driver for power utilities is electrical distribution and control, which includes transformers, switchgear and industrial circuit breakers, and industrial controls. Electrical distribution and control in turn is driven by both residential and nonresidential construction. Since we have already discussed the construction markets, we will focus on electrical distribution and control.
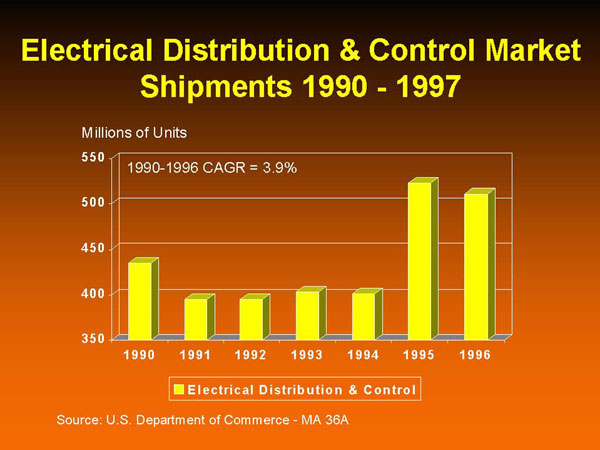
Electrical Distribution & Control
As the chart below illustrates, electrical distribution and control shipments took a considerable jump in 1995, driven by the resurgence in nonresidential and residential construction in general, and molded case circuit breakers, general purpose relays, and fuse and fuse equipment in particular. Recent trends show building codes and local requirements for residences requiring more circuits. Codes now often require single outlet circuits for appliances in kitchens and single circuit GFI circuits in bathrooms.
Electrical Distribution and Control Market
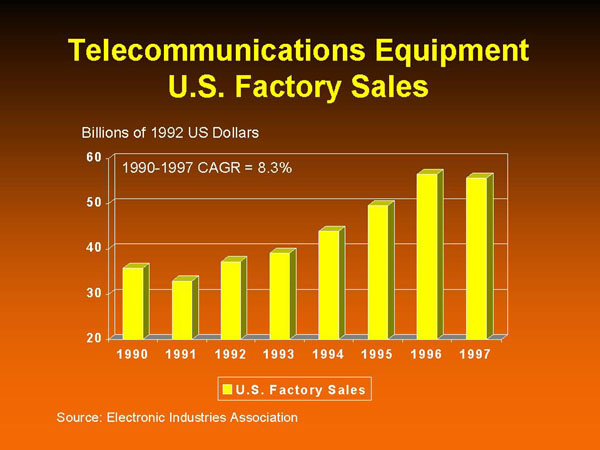
Telecommunications
The second key segment for this market, telecommunications, has seen factory sales growing at a very healthy 8.3% compound rate over the past eight years. An important sector of telecommunications, for copper, is telephone and telegraph equipment, which accounts for over one-half of U.S. factory sales. The strong growth in construction along with the increasing popularity of the Internet is helping to propel this strong growth. Many households are installing second lines to hook up their computers to the Internet, allowing them to maintain phone access as well. Another area is premises wiring. This wire is used for network wiring of computers in buildings and uses twisted pair copper wires. These local area networks have grown in the 20%+ range during the 1990's.
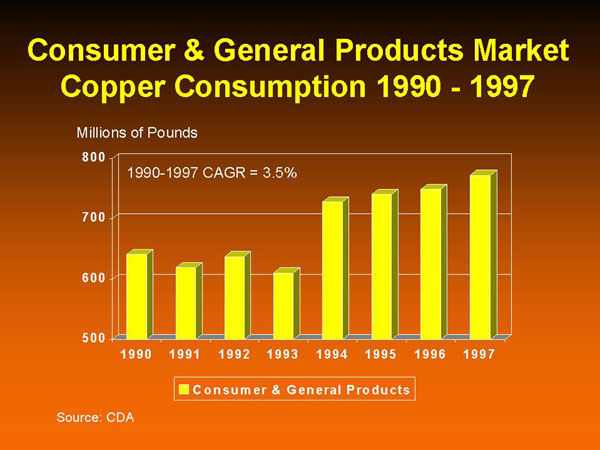
Consumer & General Products Market
Consumer and general products, with a 3.5% compound growth rate, is the fourth fastest growing market, accounting for 9% of copper consumption in 1997. This market has enjoyed four straight years of consumption over 700 million pounds with 1997 marking a 16-year high at 772 million pounds. Consumer and general products is the broadest of the five markets, composed of the following eight market segments:
- appliances;
- ordnance;
- musical instruments, toys, and medallions;
- household products;
- consumer electronics;
- fasteners & closures;
- coinage;
- utensils & cutlery
While this market has a large number of market segments, the top three account for the lion's share of copper consumption at 63% in 1997.
Consumer and General Products Market
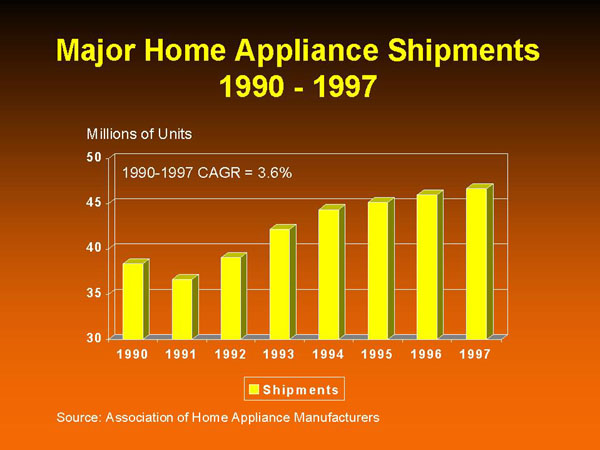
Major Home Appliances
Major home appliances is the single largest segment, accounting for almost one-third of the copper consumed. Over the past eight years this segment has grown at a 3.6% compound rate. Like other segments, appliances is composed of several sub-segments, specifically, cooking, home laundry, kitchen clean up, and food preservation. Residential construction and the replacement markets in turn drive these sub-segment markets.
Major Home Appliance Shipments
Copper Supply
Now that we have examined those markets that have exceeded real GDP in growth, we will take a look at those areas that supply the copper products. These areas have been grouped into the following five components:
- wire mills;
- brass mills;
- foundry products;
- powder products;
- net imports
As you can see from the table below, wire mills and brass mills dominate the supply of copper products accounting for 93% of shipments to copper consuming markets in 1997. The 1997 numbers for wire mills represent estimates made by the Copper Development Association, as the U.S. Department of Commerce; Bureau of the Census had not yet released their 1997 MA33L report when this paper was written.
Wire Mills
Throughout the 1990's wire mills have shipped more copper products than brass mills. As you can see from the chart below brass mills however, are narrowing the gap. In 1990 wire mills shipped almost 700 million more pounds than brass mills, by 1997 the gap was down to slightly over 300 million pounds.
Wire Mill versus Brass Mill Shipments
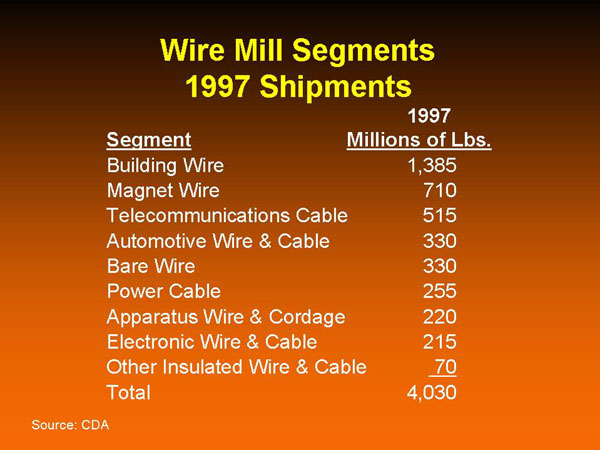
Wire mills have been segmented into the nine areas shown below. We will focus on building wire and magnet wire, which combined, accounted for over half of wire mill shipments in 1997. Building wire, by far the largest segment, had record shipments of 1.4 billion pounds in 1997, accounting for over 34% of total wire mill shipments. This volume was almost double the number shipped by the next closest segment, magnet wire. To show you the magnitude of this number, building wire shipments almost equaled the total of the last six segments.
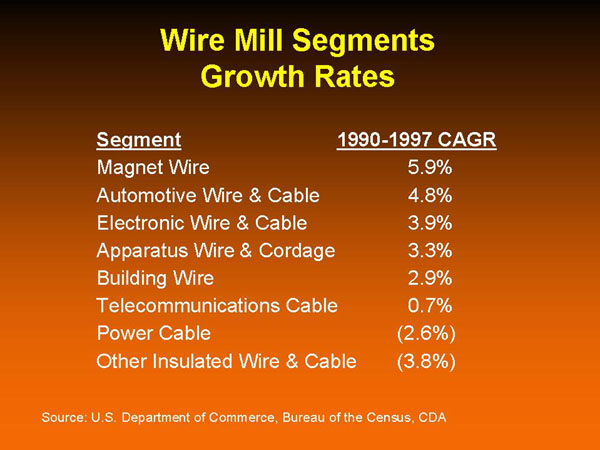
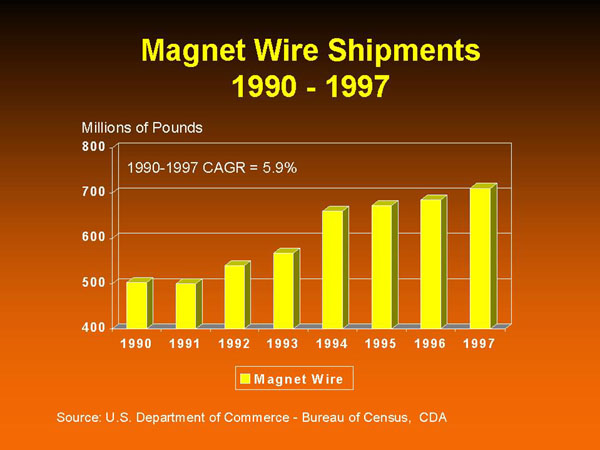
Building wire may be the largest wire mill segment, but the distinction of fastest growing belongs to magnet wire, which has grown at a 5.9% compound rate over the past eight years. The top five wire mill segments, as the table below shows, have grown faster than the 2.4% rate of real GDP. The second fastest growing segment, automotive wire and cable, with a 4.8% CAGR, has also grown at double the rate of real GDP. This segment shipped a record 330 million pounds in 1997, marking the second year in a row that shipments surpassed the 300 million pound level.
Wire Mill Segments Growth Rates
Building Wire
The residential and nonresidential construction markets, as one might surmise, drive building wire shipments. While these markets have been growing at 4.7% and 4.9% compound rates over the last eight years, respectively, building wire shipments have been growing at a considerably slower pace of 2.9%.
Magnet Wire
Now let's take a closer look at the fastest growing segment, magnet wire. In 1997 magnet wire had record shipments of 710 million pounds, crossing the 700 million-pound mark for the first time in U.S. history. This was also the fourth straight year of shipments over 600 million pounds. Magnet wire is benefiting from strong growth in its key market drivers:
- automotive;
- in-plant equipment;
- appliances;
- power utilities;
- lighting;
- air conditioning & refrigeration
Copper magnet wire products compete heavily, in certain applications, with aluminum magnet wire. Energy efficiency initiatives by the U.S. government and favorable copper prices have helped to propel the growth of copper magnet wire.
Brass Mills
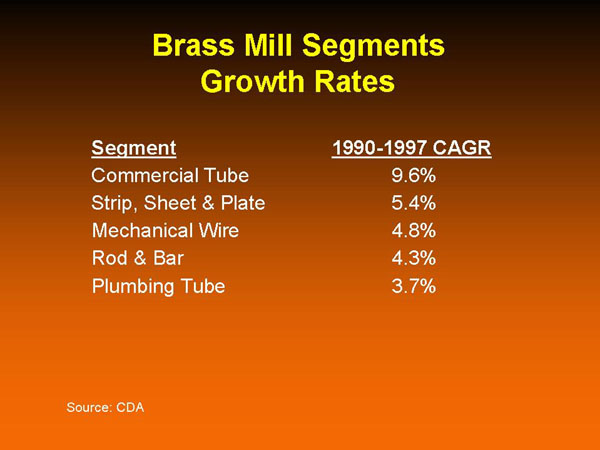
While wire mill shipments are the largest component of copper supply, brass mills are the fastest growing. Over the past eight years, brass mill shipments have grown at a compound rate of 5.2% versus 3.2% for wire mills. As the table below shows, commercial tube, by far the fastest growing segment, is leading the way with a 9.6% compound growth rate. The rate of growth for commercial tube is nearly double that of the next fastest growing segment: strip, sheet and plate, which has a 5.4% growth rate. All five of the brass mill segments have grown faster than real GDP over the last eight years.
Brass Mill Segments Growth Rates
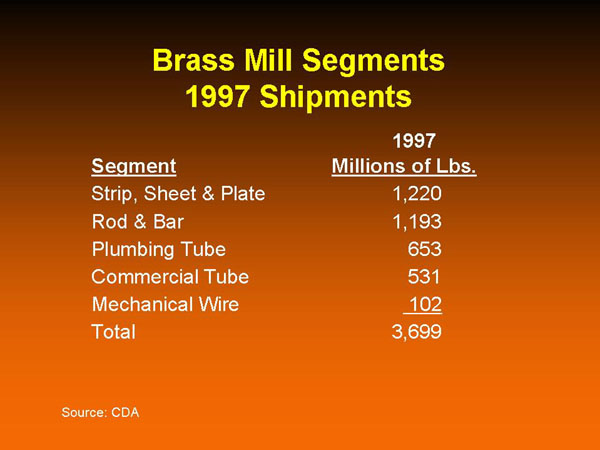
While commercial tube represents the fastest growing brass mill segment, strip, sheet and plate represents the largest. In 1997 a record 1.2 billion pounds of strip, sheet and plate products were shipped. This volume was followed closely by rod and bar products, which also had record shipments in 1997 of close to 1.2 billion pounds. Brass mills in total shipped a record 3.7 billion pounds in 1997, the fifth straight year of record shipments and also the fifth straight year of shipments over 3 billion pounds.
Brass Mill Segments/1997 Shipments
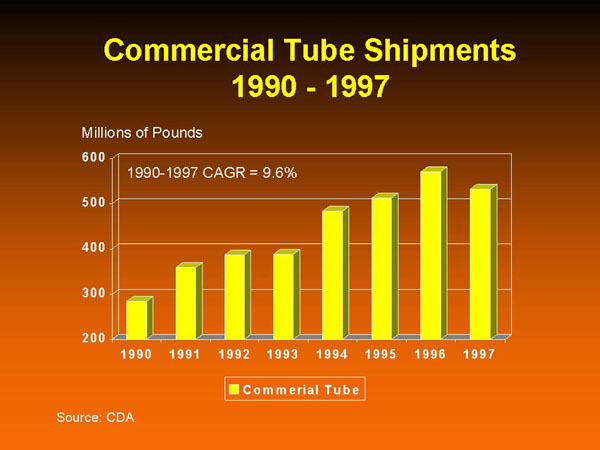
Commercial Tube
Commercial tube shipments have exceeded the 500 million-pound mark for three straight years. Mild weather and inventory adjustments brought 1997 shipments down slightly from 1996's record high of 570 million pounds. This record number of pounds doubled the tonnage shipped in 1990.
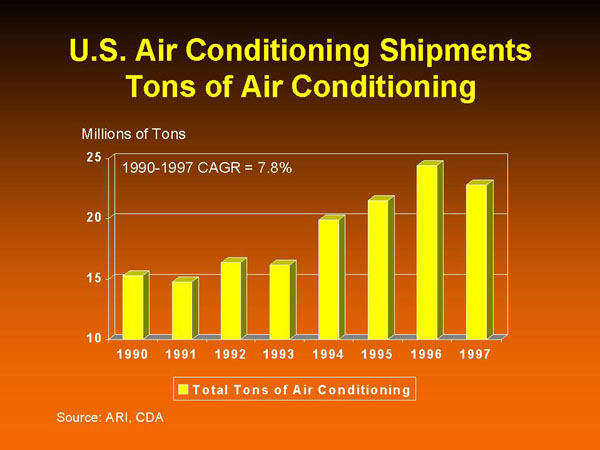
Commercial tube shipments are benefiting from strength in its primary market driver: air conditioning and refrigeration, which account for approximately two-thirds of its shipments. The measurement CDA uses for this driver is tons of air conditioning as opposed to units shipped. Tons of air conditioning is growing at a healthy compound rate of 7.8% over the last eight years. Although commercial tube shipments were down in 1997, the hot weather experienced earlier this year are helping 1998 shipments to close in on the 1996 record.
Strip, Sheet & Plate
Not only was 1997 a record year for strip, sheet, and plate shipments; it also marked the fourth year in a row that shipments surpassed the billion pound mark. Strip, sheet, and plate is benefiting from good growth in its four key market drivers: automotive production; lighting and wiring devices; telecommunications; and ordnance. These four markets account for over half of strip, sheet, and plate shipments.
Strip, Sheet & Plate Shipments
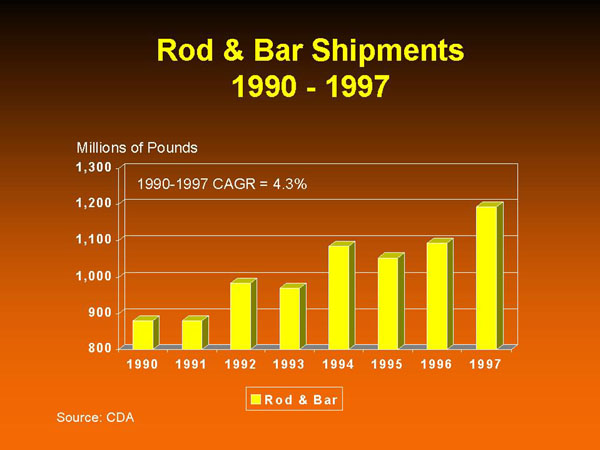
Rod & Bar
Rod and bar is the second largest brass mill segment, growing at a 4.3% compound rate over the last eight years. Like strip, sheet, and plate it too has shipped over 1 billion pounds for four straight years. 1997 also marked the fourth straight year of record shipments. Rod and bar however, unlike strip, sheet, and plate and commercial tube, tends to have unique market drivers for its copper and copper alloy products. Copper rod and bar shipments are driven by its primary market driver power utilities, which account for over 75% of demand. While the plumbing and heating and valves and fittings markets drive copper alloy rod and bar shipments. These two markets drive almost 60% of copper alloy rod and bar demand.
Mechanical Wire
Mechanical wire, the smallest of the brass mill segments, is also enjoying good growth, with a compound rate of 4.8% over the past eight years, twice the rate of real GDP. In 1997 mechanical wire shipments surpassed the 100 million-pound mark for the first time in 19 years. Mechanical wire has enjoyed six straight years of growth driven by its key markets. Like rod and bar, mechanical wire has unique market drivers for copper and copper alloy products. Its main market driver for copper products is power utilities. While its main market drivers for copper alloy products are automotive production and fasteners.
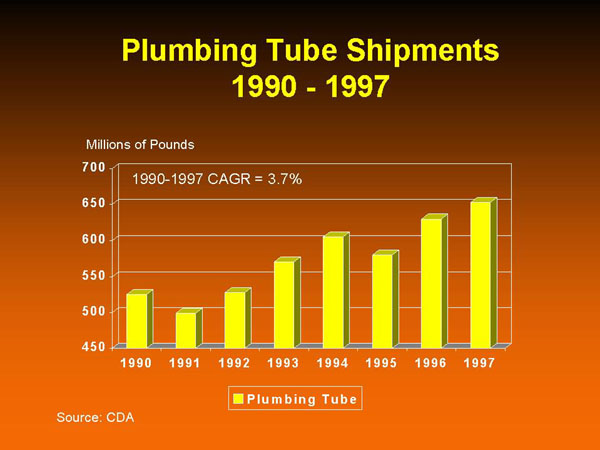
Plumbing Tube
Last but not least of the brass mill segments is plumbing tube. This segment had record shipments of 653 million pounds in 1997. Plumbing tube shipments have exceeded the 600 million-pound mark three out of the last four years. 1994 also marked the first year that plumbing tube shipments passed 600 million pounds. The strength in plumbing tube shipments are being driven by the new construction and air conditioning and refrigeration markets. These two areas account for over 90% of plumbing tube demand.
Trade
Now let's examine the impact of trade on copper demand. We are all aware of the globalization of markets and hear almost on a daily basis the affects that Asia and Russia are having on the rest of the world. We are also aware of the increasing number of regional trading blocks; most close to home of course is NAFTA.
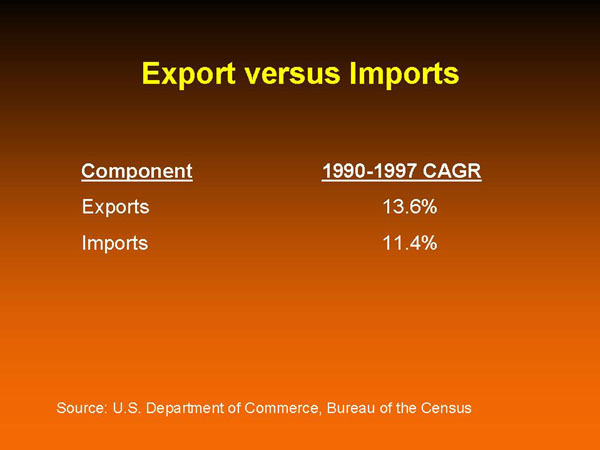
Exports
U.S. companies continue to expand operations overseas to take advantage of foreign markets. This often creates trade opportunities for their domestic suppliers. These types of events have helped exports to grow faster than imports over the past eight years, 13.6% and 11.4% respectively.
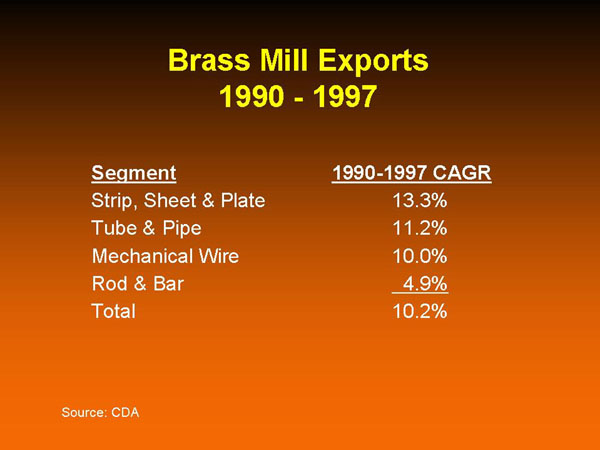
The growth in exports has been lead by wire mill products, which have grown at a 16.9% compound rate over this period. Brass mill exports however, have lagged behind with a 10.2% rate.
As you can see from the table, rod and bar exports have grown the slowest over this time period with a 4.9% growth rate. While strip, sheet and plate exports have grown the fastest at 13.3%. Strip, sheet and plate exports doubled in volume over this time period going from 54 million pounds in 1990 to 119 pounds in 1997.
Imports
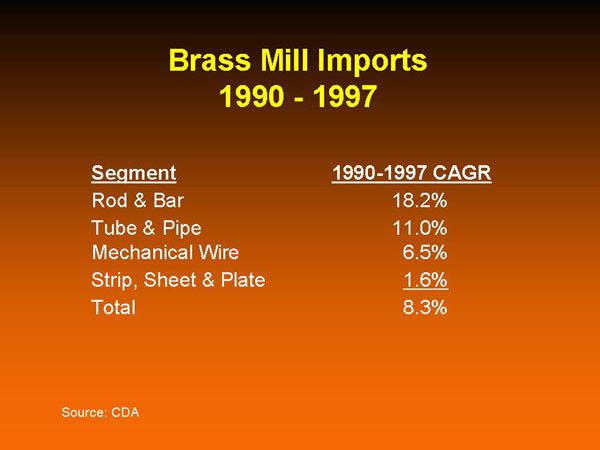
Imports have grown at a slightly slower rate between 1900 and 1997 (11.4%). Wire mill imports however, are growing at a substantially faster rate than brass mills, 19.1% and 8.3% respectively. As you can see from the table below, brass mill imports are being slowed down by imports of strip, sheet and plate products, which have grown at a compound rate of only 1.6% over the last eight years.
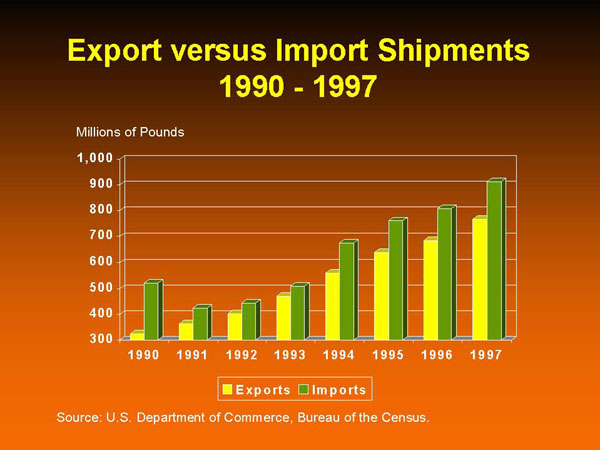
Although exports are growing faster than imports, imports still account for more pounds than exports do. As a result, the U.S. remains a net importer of mill products. In 1997 the U.S. was a net importer of approximately 147 million pounds of mill products. This figure however, is down substantially from the net imports of 560 million pounds in 1984. And if the numbers are examined in greater detail, we find that wire mills were actually net exporters in 1997 and have been throughout the 1990's.
Export versus Import Shipments
Outlook for Copper
While the overall outlook for copper is very positive, no industry grows in a straight line forever. Copper has had good growth over the past eight years and the major market drivers for copper point toward continued growth in 1998. Shipments of copper products are on a pace to achieve another record year in 1998 and are expected to finish approximately 3% ahead of last year. Although some markets are beginning to show some softening from the Asian crises, it is too early to predict that shipments will be off in 1999.
Conclusion
Copper demand has grown at a 3.8% over the last eight years, driven by strong growth in its transportation; building construction; and electrical and electronic markets; as well as strength in exports. Despite the economic slump in Asia and Russia, the underlying strength in the U.S. economy should enable 1998 demand for copper products to increase by 3%. Although the economies in Asia continue to deteriorate, it is too early to predict that copper demand will be down in 1999.