ABSTRACT
Experimental-size specimens of two different compositions of nickel-aluminum bronze were cast, subjected to five different heat treatments and were exposed to seawater. Both alloys were in compliance with UNS C95800 and MIL-B-24480, except that the aluminum content of one alloy, at 8.1%, was below the lower limit of the specified compositional range. Their microstructures were characterized and correlated with corrosion resistance. Selective phase attack was seen in both alloys, although it was much more pronounced in the alloy with the lower aluminum content, to the point where entire grains fell out. It was observed that the higher aluminum-containing alloy had markedly superior corrosion resistance. Thus it is important to maintain the aluminum level in alloy UNS C95800 at or above the lower limit, and within the specified range of 8.5-9.5%.
Keywords: Aluminum Bronze, Nickel-Aluminum Bronze, Seawater, Microstructure, Martensite, Bainite, Eutectoid, Alpha, Widmanstatten, Phase, Corrosion, Localized Corrosion, Selective Phase Corrosion, Selective Attack, Depth of Attack, Depth of Penetration, UNS C95800, MIL-B-24480.
INTRODUCTION
The alloys in the aluminum bronze family typically contain 5% to 11% aluminum. In addition, some of the alloys contain iron, nickel, manganese or silicon. They are available in both wrought and cast product forms, and offer good combinations of mechanical properties and corrosion resistance. Consequently, they have been used for decades in a wide variety of marine applications including valves and fittings, ship propellers, pumps, pump shafts, valve stems and heat exchanger waterboxes (1). Aluminum bronze has many attributes, but can occasionally exhibit deficiencies under certain circumstances (2). As reported by Meigh (3), Sperry (2) stated, over ninety years ago, “After much good and bad experience with it, I will frankly say that it is bronze without peer, and the early worshippers of it did not overate it by any means.” In this instance (2), the bad experience referred to problems encountered in producing sound billets and castings due to dross and shrinkage. The subject of this paper touches upon another problem area, the seawater corrosive attack of high-strength nickel-aluminum bronze (4-8), which is sporadically experienced in service.
Nickel-aluminum bronzes are generally two-phase, duplex alloys containing 5% to 11% aluminum as well as additions of iron and nickel for strength (9). Increasing the aluminum content results in higher strength, which is attributable to a hard, body-centered-cubic phase, which enhances properties of castings as well as hot working in wrought alloys (9). The other alloying elements also improve properties and alter microstructure. Specifically, nickel improves corrosion resistance, while iron acts as a grain refiner and increases tensile strength. Nickel also raises yield strength, and both nickel and manganese act as microstructure stabilizers (9). Nickel-aluminum bronzes are metallurgically complex alloys in which small variations in composition can result in the development of markedly different microstructures (3, 10, 11), which can, in turn, result in wide variations in seawater corrosion resistance. Those microstructures, which result in optimum corrosion resistance, are obtained by control of composition and heat treatment (12). The subject of this paper is the evaluation of the effect of a small change in aluminum content, as well as heat treatment, on microstructure and of their influence on seawater corrosion resistance.
EXPERIMENTAL PROCEDURE
The present study explores the effect of variations in aluminum content on the seawater resistance of cast nickel-aluminum bronze. The two alloys designated, Alloy A (9.4% Al) and Alloy B (8.1% Al), comply with the compositional limits of UNS C95800 in all respects except that Alloy B falls below the minimum aluminum content of 8.5%, as shown in Table 1. Both Alloy A and Alloy B were cast, solution-annealed for 5 hours at 1,000 °C, and subjected to one of five different heat treatment sequences, as shown in Table 2. This included tempering some of the samples for 6 hours at 675 °C, as also indicated in Table 2.
| Cu | Al | Ni | Fe | Mn | |
|---|---|---|---|---|---|
| UNS C95800 1 | 79.0 min. | 8.5-9.5 | 4.0-5.0 2 | 3.5-4.5 2 | 0.8-1.5 |
| Alloy A (9.4% Al) | 81.8 3 | 9.4 | 4.0 | 3.5 | 1.3 |
| Alloy B (8.1% Al) | 82.6 3 | 8.1 | 4.4 | 3.7 | 1.2 |
| 1 MIL-B-24480 2 Iron content shall not exceed nickel content. 3 By difference. |
|||||
| Alloy | Heat Treatment 1 | Heat Treatment Code | Specimen |
|---|---|---|---|
| Alloy A (9.4% Al) | Oil-Quenched | O-Q | 11 and 12 |
| Oil-Quenched + Tempered 2 | O-Q + T | 13 and 14 | |
| Air-Cooled | A-C | 15 and 16 | |
| Air-Cooled + Tempered 2 | A-C + T | 17 and 18 | |
| Furnace-Cooled | F-C | 19 and 20 | |
| Alloy B (8.1% Al) | Oil-Quenched | O-Q | 1 and 2 |
| Oil-Quenched + Tempered 2 | O-Q + T | 3 and 4 | |
| Air-Cooled | A-C | 5 and 6 | |
| Air-Cooled + Tempered 2 | A-C + T | 7 and 8 | |
| Furnace-Cooled | F-C | 9 and 10 | |
| 1 All solution-annealed for five (5) hours at 1000 ° C prior to subsequent heat treatment. 2 Tempered for six (6) hours at 675 ° C. |
|||
Nominal corrosion test specimen dimensions were 6mm x 25mm x 76mm, with an average surface roughness of 0.5 µm to 0.8 µm. Prior to testing, duplicate samples of each alloy in each of the five conditions of heat treatment were acetone degreased, measured, scrubbed and subjected to a final degreasing and weighed.
All the specimens were hung from glass rods, which were passed through a 6mm hole near the top of each specimen. Since the diameter of the glass support rod was smaller than the 6mm specimen hole diameter, this resulted in crevices which were not overly severe. The specimens were exposed for six months in a slowly flowing seawater test trough at LaQue Center for Corrosion Technology at Wrightsville Beach, North Carolina, USA. The source seawater composition and properties are shown in Table 3. The seawater was filtered (5-10μm) and continuously refreshed, resulting in at least four daily changes of seawater in the trough. Prior to any adjustment, the temperature of natural seawater ranged from 9 °C to 28 °C. During the colder months, a quartz heater was used in conjunction with a recirculating pump to heat the seawater. The mean daily temperature of the seawater, to which the specimens were exposed, was 29 °C, with a standard deviation of 1.6 °C. The flow velocity was estimated at <0.01m/s parallel to the 25mm x 76mm specimen face.
| Ambient Temperature Range | 9.0 – 28.4 °C |
|---|---|
| Salinity | 31.32 - 37.29g/l |
| Chlorinity | 17.72 - 20.61g/l |
| pH | 7.8 - 8.1 |
| Dissolved O2 | 4.52 - 9.33mg/l |
| Sulfate | 2650 - 2790mg/l |
| Iron (Total) | 0.009 - 0.102mg/l |
| Sulfide | <0.005mg/l |
| Copper | <0.001 - 0.005mg/l |
| Ammonia | <0.05mg/l |
| Conductivity | 31.1 - 50.1mmhos/cm |
After 6 months of exposure, specimens were removed and rinsed with tap water, bristle-brush scrubbed with detergent, water- and acetone-rinsed, air-dried and weighed to determine mass loss. Localized attack was measured optically or with a dial depth gauge. A number of specimens were subjected to detailed metallographic examination, including their cross sections.
RESULTS
General Appearance
During the six-month exposure, the specimens were periodically inspected in situ. Initial signs of corrosion appeared as a general darkening. For some specimens, discrete sites of localized attacks appeared in 60 to 120 days. Eventually localized attack was observed near the glass rods and elsewhere. Worst-case examples, as determined by visual examination, of the corrosion affecting Alloys A and B specimens, in all five conditions of heat treatment, are presented in the top and bottom of Figure 1, respectively. The heat treatment codes, going from left to right, are O-Q (Oil-Quenched), O-Q + T (Oil-Quenched + Tempered), A-C (Air-Cooled), A-C +T (Air-Cooled + Tempered), and FC (Furnace-Cooled). In regard to Alloy A, specimens in all five conditions of heat treatment showed slight attack near the specimen hole. In addition, heat treatment O-Q showed scattered areas of slight attack. In contrast, all the Alloy B specimens show significant localized "gravity-assisted" attack, which developed under accumulated corrosion product emanating from the hole. While duplicate specimens of both alloys in five conditions of heat treatment were tested, only one side of each Alloy B specimen developed "gravity assisted" or "drip-like" attack. In contrast, attack was hardly noticeable, to any extent, on the other side. Although, it is difficult to quantify on the basis of only ten Alloy B specimens, the side where the most pronounced attack occurred appeared to be random. It was not related to tilting of the trough, or the glass holding rods, nor is it believed to be associated with sample position, cross currents or differences in flow. Again, the flow rate was <0.01 m/s.
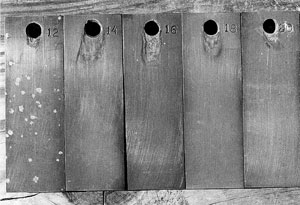
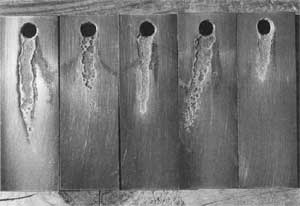
FIGURE 1: Cleaned Specimens of Alloy A (9.4% Al) (top photo) and Alloy B (8.1% Al) (bottom photo) Solution-Annealed and Subsequently Subjected to Various Heat Treatments, which are, (from left to right): Oil-Quenched (O-Q), Oil-Quenched + Tempered (O-Q + T), Air-Cooled (A-C), Air-Cooled + Tempered (A-C + T), and Furnace-Cooled (F-C): Magnification (1X).
Mass Loss and Corrosion Rate
Individual mass losses for all twenty specimens after six months of exposure and subsequent bristle brush removal of bulk corrosion products are shown in Table 4. As can be seen, Alloy A displayed a lower average mass loss of 0.1381g and less variability, with a standard deviation of 0.0427g, than seen in Alloy B, which exhibited an average mass-loss of 0.5170g and a standard deviation 0.1602g. For Alloy B, this variation generally correlates with the extent of localized attack observed in Figure 1, except for Specimen 10, which appears to exhibit less attack than the other Alloy B specimens, as can be seen in the bottom of Figure 1. However, this may be related to poor image depth perception, in that the Hole-Related Depth of Attack in Specimen 10 is quite high, as can be seen in Table 6. Overall, the above mass-loss results for all the specimens show no clear correlation with the heat treatments afforded to both alloys.
| Heat Treatment Code | Alloy A (9.4%Al) | Alloy B (8.1%Al) | ||||
|---|---|---|---|---|---|---|
| Mass Loss | Mass Loss | |||||
| Specimen | Grams | Avg. Grams | Specimen | Grams | Avg. Grams | |
| O-Q | 11 | 0.1100 | 1 | 0.2950 | ||
| O-Q | 12 | 0.1500 | 0.1300 | 2 | 0.6250 | 0.4600 |
| O-Q+ T | 13 | 0.2100 | 3 | 0.2450 | ||
| O-Q+ T | 14 | 0.2425 | 0.2263 | 4 | 0.5000 | 0.3725 |
| A-C | 15 | 0.1300 | 5 | 0.3750 | ||
| A-C | 16 | 0.1875 | 0.1588 | 6 | 0.6300 | 0.5025 |
| A-C+ T | 17 | 0.1425 | 7 | 0.6050 | ||
| A-C+ T | 18 | 0.1450 | 0.1438 | 8 | 0.6900 | 0.6700 |
| F-C | 19 | 0.1125 | 9 | 0.5300 | ||
| F-C | 20 | 0.1505 | 0.1315 | 10 | 0.6750 | 0.6025 |
| AVERAGE | 0.1381 | 0.5170 | ||||
Corrosion rates based solely on mass loss can be misleading in specimens exhibiting extensive localized attack. Accordingly, corrosion rates have been calculated for only Alloy A specimens, since the calculated corrosion rates for Alloy B would have been unduly influenced by their high levels of localized attack. The calculated corrosion rate for Alloy A in various conditions of heat treatment ranged from 5.6 - 12.2 µm/y, and the average is 7.9 µm/y or ~0.3mils per year, as presented in Table 5.
| Heat Treatment Code | Specimen | µm/y |
|---|---|---|
| O-Q | 11 1,2 | 5.6 |
| O-Q | 12 1,2 | 7.9 |
| O-Q + T | 13 2 | 10.7 |
| O-Q + T | 14 2 | 12.2 |
| A-C | 15 2 | 6.6 |
| A-C | 16 2 | 7.9 |
| A-C + T | 17 2 | 7.1 |
| A-C + T | 18 2 | 7.4 |
| F-C | 192 | 5.6 |
| F-C | 20 2 | 7.6 |
| AVERAGE | 7.9 | |
| 1 Discrete areas of attack. 2 Some hole-related corrosion (preferential attack at and below mounting holes). |
||
Depth of Penetration
Depth of attack was measured and is presented in Table 6. For Alloy A, the localized surface depth of attack, for all specimens, ranged from 0.01 - 0.23mm, and the average localized surface depth of attack varied from 0.01 - 0.15mm. The maximum hole-related depth of attack measured on Alloy A ranged from 0.02 - 0.62mm. Alloy B exhibited localized surface depth of attack on all specimens, ranging from 0.01 - 0.03mm and average localized depth of attack varied from <0.02mm - 0.02mm. On Alloy B, the maximum hole-related depth of attack was much greater than seen on Alloy A and varied from 0.33 to 0.79mm. However, the gravity-assisted drip-like corrosion product would probably have be swept away in actual service, thus resulting in little or no significant under-deposit attack.
| Alloy and Heat Treatment | Localized Surface Depth of Attack 1 | Hole-Related Depth of Attack | ||
|---|---|---|---|---|
| Heat Treat Code | Range | Average | Maximum (side)2 | |
| Alloy A (9.4%Al) | ||||
| 11 | O-Q | 0.05-0.23 | 0.15 | Not Determined |
| 12 | O-Q | 0.04-0.21 | 0.11 | 0.43 (F) |
| 13 | O-Q+T | 0.01-0.04 | <0.02 | 0.08 (F) |
| 14 | O-Q+T | 0.01-0.01 | 0.01 | 0.02 (F) |
| 15 | A-C | 0.01-0.02 | <0.02 | Not Determined |
| 16 | A-C | 0.04-0.05 | 0.05 | 0.16 (F) |
| 17 | A-C+T | 0.03-0.18 | 0.09 | 0.62 (F) |
| 18 | A-C+T | 0.02-0.05 | 0.03 | 0.20 (F) |
| 19 | F-C | 0.01-0.05 | <0.02 | 0.10 (F) |
| 20 | F-C | 0.01-0.06 | 0.03 | 0.12 (F) |
| Alloy B (8.1%Al) | ||||
| 1 | O-Q | 0.01-0.03 | 0.02 | 0.45 (F) |
| 2 | O-Q | 0.01-0.03 | < 0.02 | 0.70 (B) |
| 3 | O-Q+T | 0.01-0.03 | 0.02 | 0.38 (F) |
| 4 | O-Q+T | 0.01-0.03 | 0.02 | 0.58 (B) |
| 5 | A-C | 0.01-0.03 | < 0.02 | 0.42 (F) |
| 6 | A-C | 0.01-0.03 | 0.02 | 0.79 (B) |
| 7 | A-C+T | 0.01-0.03 | 0.02 | 0.75 (B) |
| 8 | A-C+T | 0.01-0.02 | < 0.02 | 0.78 (B) |
| 9 | F-C | 0.01-0.03 | 0.02 | 0.33 (B) |
| 10 | F-C | 0.01-0.03 | 0.02 | 0.60 (B) |
| 1 Not related to the hole 2 (F) = front, (B) = back |
||||
The observation that localized attack, which is related to corrosion product emanating from the hole, which was restricted to one side of the specimen was investigated. It was postulated that back-to-front surface attack might be associated with inner or outer surfaces of original cast pieces, in that castings were split after heat treatment along their smallest dimension to obtain duplicate test specimens. Alloy B in the oil-quenched (O-C) condition was subjected to polarization testing (13). Testing commenced at Ecorr and proceeded in the noble direction at 10mV/min. At an anodic current density of 2 mA/cm2, the scan was reversed until the initial Ecorr value was reached. The forward scans of both curves were quite similar, while the reverse scans differed somewhat. It was unclear if the difference in polarization provided any insight into the difference observed in back-to-front localized corrosion. It seems that the back-to-front differences are random and conceivably, when attacks start on one side, it possibly influences or minimizes attack on the reverse side.
Correlation with Microstructure
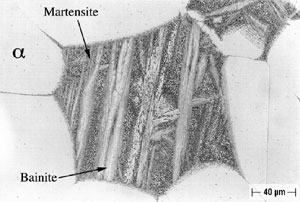
Microstructures of both Alloy A and Alloy B were examined and all phases were named in accord with the convention developed by Howell (10). As shown in Figure 2, Alloy A in the oil-quenched (O-Q) condition contained Widmanstatten α within a matrix of Martensite. When air-cooled (A-C), Alloy A contained somewhat more Widmanstatten α than the oil-quenched (O-Q) sample, as shown in Figure 3. In addition, Alloy A (A-C) contained Martensite and Bainite plus fine eutectoid surrounding the Widmanstatten α. In Alloy A, tempering transformed Martensite (and Bainite) to a fine eutectoid. This is a more diffuse or as a less distinct structure, which is termed complex α (10). Alloy A, when furnace cooled (F-C), contained Widmanstatten α, eutectoid and traces of Bainite and Martensite.
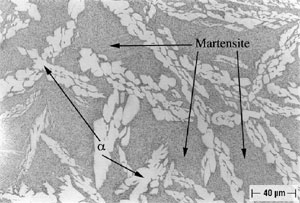
FIGURE 2: Alloy A (9.4% Al), Solution-Annealed and Oil-Quenched (O-Q).
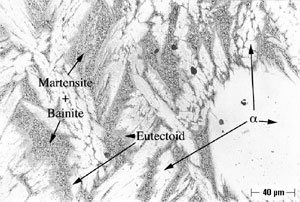
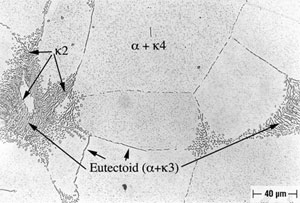
Alloy B, in both oil-quenched (O-Q) and air-cooled (A-C) condition, is free of Widmanstatten α, but does contain equiaxed α, as shown in Figures 4 and 5. In addition both conditions of Alloy B contain isolated regions of Bainite and Martensite, as is also shown in Figures 4 and 5. In furnace-cooled (F-C) Alloy B, equiaxed α and eutectoid, as well as several varieties of kappa ( κ ) phase (10), can be seen, as shown in Figure 6. Tempering Alloy B results in a wholly equiaxed α microstructure.

FIGURE 4: Alloy B (8.1% Al), Solution-Annealed and Oil-Quenched (O-Q).
An example of selective phase attack in Alloy A after six months of exposure to seawater, is shown in Figure 7. In this case, it is in the oil–quenched (O-Q) condition. The Martensite, which is intersperced between the Widmanstatten α, is preferentially attacked, as can be seen in Figure 7. This is in agreement with the observations of Lorimer, et al (7) in as-cast material exposed to artificial seawater. In Alloy B, selective phase attack after six months of exposure to seawater is also apparent and much more pronounced that that observed in Alloy A. In air-cooled (A-C) Alloy B, Martensite (and Bainite) are equiaxed and surrounded by equiaxed α. The Martensite is again attacked and to such an extent that entire Martensite grains fall out, as shown in Figure 8. In furnace-cooled (F-C) Alloy B, eutectoid α,which is present in both grain boundaries and in colonies, is susceptible to attack.
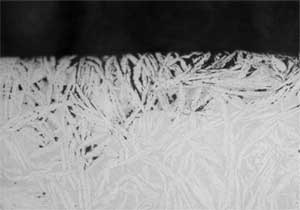
FIGURE 7: Selective Phase Attack on Alloy A (9.4% Al), Solution-Annealed and Oil Quenched (O-Q) After Six Months of Seawater Exposure: Magnification (200X).
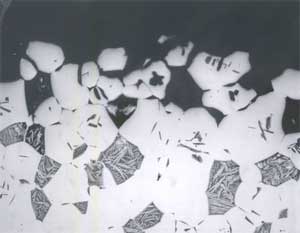
FIGURE 8: Selective Phase Attack on Alloy B (8.1% Al), Solution Annealed and Oil Quenched(O-Q) After Six Months of Seawater Exposure: Magnification (100X).
CONCLUSIONS
Based upon only two compositions in five conditions of heat treatment, it would be imprudent to reach broad conclusions in regard to seawater corrosion resistance, particularly in such a complex alloy system. Nevertheless, it can be concluded that, based upon physical appearance, mass loss and metallographic examination after exposure to seawater, Alloy B is less resistant to seawater corrosion than Alloy A. The aluminum content of Alloy B falls outside the lower limit for aluminum (8.5%) listed in UNS C95800. Therefore, the aluminum content of nickel-aluminum bronze should be above 8.1%, and not lower than the specification minimum of 8.5%. In large as-cast components, where the average chemistry falls within the UNS C95800 compositional limits, it is conceivable there may be local regions, which fall below the lower limit of 8.5% aluminum. Therefore, these portions of a large as-cast component may be susceptible to preferential corrosion in seawater. Tempering in the range of approximately 675°C should reduce and, hopefully, minimize corrosive attack in large castings, which is in agreement with the conclusions of Ferrara and Caton (5), who recommended an eight hour heat treatment at 700°C. This is also in accord with the Culpan and Rose (8), who, after welding both as-cast and heat treated alloys and then subjecting them to heat treatment, observed a marked improvement in selected phase attack in seawater.
The difference in aluminum content of Alloy A and Alloy B resulted in markedly different microstructures. Hence, seemingly small variations in aluminum can change the phases which develop. Alloy A (9.4% Al) consists of Widmanstatten α plus Martensite and Bainite intersperced between the Widmanstatten α. Alloy B (8.1%) has an equiaxed α microstructure with isolate equiaxed regions of Martensite and Bainite.
In regard to the effect of heat treatment on mass loss after exposure to seawater, no apparent correlation is seen in either alloy. In regard to localized attack, there was, again, no correlation with heat treatment discernible in either alloy, with the exception of Alloy A in the oil quenched (O-Q) condition. Both samples of Alloy A (O-Q) showed a somewhat higher average depth of attack in comparison to the other eight Alloy A samples, which were subjected to four other conditions of heat treatment. The corrosion rates, which were only determined for Alloy A also show no correlation with heat treatment. The gravity-assisted drip-like corrosion product, which was most pronounced on Alloy B, would probably be swept away under normal service conditions, because the operating velocities would be well above the <0.01 m/s test velocity. Presumably the associated under-deposit localized attack would also be minimized. In regard to selective corrosion on Alloy A, the Martensite phase, intersperced between the Widmanstatten α phase, was attacked. In Alloy B the isolated islands of equiaxed Martensite and Bainite, which are scattered among the continuous equiaxed α, were selectively corroded, to such an extent that entire grains fell out.
ACKNOWLEDGMENT
Support and funding, was provided by the Copper Development Association Inc. (CDA). We would also like to thank Professor Paul Howell and K.C. Meinert of Pennsylvania State University for assistance in identification of phases from in the photomicrographs. In addition, we wish to thank the management and staff of the LaQue Center for Corrosion Technology and Nelson Loi of the CDA for technical and logistical support.