Abstract
Previous work in flow simulation and runner system balancing has demonstrated the impact that small changes in gate size have on cavity filling. Gate wear affects shear rate and in turn, the viscosity of the melt. The flow of glass filled material has long been identified as a factor in tool wear. As part of the long-term wear studies of copper alloys and tool steels at Western Michigan University, careful scrutiny was given to wear of edge gates due to the flow of molten plastic. Certain hard coatings and alloys were shown to demonstrate superior resistance to wear.
Background and Introduction
In the ongoing pursuit of increased production efficiency, factors that limit cycle time have received increasing scrutiny. In some mold designs, the cycle time limiting characteristic tends to be the design runner and gating system. This is true with fairly large diameter runners supplying thinner walled parts. As pressure drop issues may be the deciding factor on the runner size, molders have turned to a number of strategies to eject the parts earlier. One strategy has been to use high strength, high thermal conductivity copper alloys for the runner system to increase the rate of heat removal.
Previous research on cores and cavities made from copper alloys determined that design of the heat path between the copper insert and the cooling medium was critical for the success of the design 1 . This can include either direct contact between a water line, bubbler or baffle and the runner bar insert, or a secondary copper insert in contact with the runner bar and the water system. In either case the heat must find a high conductivity path between the plastic and the water 1 .
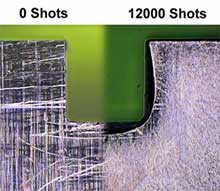 Figure 1. Bell mouthing at the exit of a P20 edge gate.
An important concern raised regarding the application of high strength, high thermal conductivity copper alloys in runner bars was the belief that gates cut in the copper alloys would wear excessively in the plastic flow and high gate shear. Indeed, previous studies have shown that gate exit geometry can be worn in a relatively short run 2 . The composite image in Figure 1 shows the wear effects of 12,000 shots of 33% glass filled nylon can have on the exit of a .76 x .76 mm (.030" x .030") edge gate 2 . It can be assumed this wear would continue until the gate size was altered to the point were the optimal shear rate could no longer be attained by the process.
The work presented here represents one facet of the ongoing wear research at Western Michigan University 3, 4 . This study subjected a series of edge gates to 33% glass filled nylon at a shear rate of 63,600 sec 1. The study investigated the principal copper alloys and tool steels in an unplated condition, as well as a series of hard coatings and platings applied to protect the runner system. The following discussion reviews the erosive wear performance of gates made from these various combinations of materials and coatings.
Description of Equipment
The study was performed with a geometrically balanced, eight-cavity mold. Resin was delivered through a DME straight shot sprue bushing. Four side interlocks were used to assure proper mold alignment. The B halve of each cavity had a single core pin and ejection was assisted by a sleeve ejector. The core pins were 159 mm (6.25") long and ran from the back of the tool to the cavities. To assure proper ejection action, the ejection system includes a four-point guided ejector plate with early return pins.
Coolant was distributed within the mold by ¼ NPT water lines configured in a single circuit around the perimeter of both halves of the tool. Four baffles in each circuit were used to bring the coolant closer to the cavities. A copper alloy chill plate placed in contact with the core pin provided cooling. The chill plate had a single coolant circuit and was located at the back of the tool. Water temperature was maintained at 18 C (65 F).
 Figure 2. Tool layout of the cavity plate.
Two removable runner bars were used to distribute resin to the cavities, each delivering resin to four cavities. The runner bars were installed in one of two locations in the tool; either the upper or lower positions ( Figure 2). The gating design consisted of edge gates having a cross section of .76 x .76 mm (.030" x .030") and minimal draft (less than 1 per side). The runner bars also formed a section of the part cavity; this cavity surface had a draft angle of 2.
The parts molded during the experimentation were small circular caps with two ribs running through the bottom of the part. The caps had a diameter of 19 mm (.75") and were 5 mm (.20") tall. Nominal wall thickness was .64 mm (.025 in.). The ribs were 1.5 x 1.5 mm (.06 x .06") and ran parallel to each other across the inside of the part. The material used in the study was 33% glass-filled nylon 6 supplied by Honeywell. The material was selected because of the well-known abrasive properties of glass reinforcement and familiarity of glass filled nylon in the industry.
All experimentation was conducted with the use of 77 metric ton (85-ton) VanDorn hydraulic toggle injection molding machine. The injection-molding machine used a 35 mm (1 ⅜" diameter) plastication screw and had a shot size of 20.6 cubic centimeters (5 ounces). An AEC mold temperature controller was used to regulate the mold coolant. Flow rate, input and output temperatures, and pressure loss was monitored in all mold coolant circuits.
Resin handling was accomplished with the use of Autoload vacuum loading devices. The resin was dried to a moisture content of .02% in a Unidyn dryer. Moisture content was determined with an Arizona instrument Moisture Analyzer. A Wyko interference microscope and a Nikon Video Microscope were used to measure and document the wear of various locations of the runner bars.
Experimental Design
Independent variables for the study included runner bar material type, number of shots and runner bar location. The runner bars were constructed from the copper alloys C18000 (85-96 R B), C17510 (95-100 R B), and C17200 (34-40 R c). Six plating treatments were tested in the experiment. These plating conditions were: unplated, hard chrome (66-70 R c), electroless nickel (50 R c), titanium nitride (TiN) (84 R c), Armoloy Thin Dense Chrome (TDC)® (72 R c), and Armoloy XADC® (90 R c). To provide a benchmark or control, runners were also constructed of H13 (52 R c) and P20 (32 R c). These steel runners bars were tested in unplated condition only. With the exception of the steel materials, each combination of base material and coating was tested. A single dependent variable was the visually observed wear of the gates in the runner bars.
A replicate of all treatments was also conducted. The order of testing was randomly selected, as well as the position of the bar (upper or lower). The replicate of each treatment was placed in the position opposite that used for the first run to help control for positional effects.
Prior to testing, critical areas of each runner bar were photographed with a Nikon Video Measurescope. These areas included the entrance, exit, and bottom (land) of each gate as well as the parting line surface above each gate. Interference microscopy was also performed prior to testing to establish the topography of the gate land.
To begin each testing run, the appropriate runner was selected from the insertion order and placed in the tool in the required position. The press was started and run for a predetermined number of shots. The molding process was kept consistent during the testing of the runner bars. Overall cycle time was 6 seconds consisting of 1.5 seconds of injection and pack, 2 seconds of cure, and 2.5 seconds of mold action and ejection.
At intervals up to a maximum of 6000 shots, the runners were removed from the tool and visually inspected. Areas of the bars that were appraised included the bottom and side of the gate land, the parting line surface, the cavity surfaces and the primary, secondary and tertiary runners. Comments were entered into a database along with the shot count and the identification of the runner combination.
At this time an assessment was made as to the condition of each runner bar. With coated runner bars, failure of the sample was defined as exposure of the underlying base material in at least two gates. For uncoated runners, the failure criterion was defined as the erosion of the machining marks in at least two gates. If a runner bar had not reached failure, it was inserted back into the tool and the next testing cycle was begun. Once a bar failed, interference and video microscopy were performed at the previously described locations. The data were analyzed using the statistical analysis software Statistica 5 . Standard analysis of variance (ANOVA) methods and the least squares difference (LSD) mean separation procedure were used to test for differences among the treatment groups.
Findings
From the collected data, the total number of shots to failure of each gate bar was calculated for each treatment group. The average number of shots-to-failure for P20 was used as a benchmark for the remaining base/coating treatments. Figure 3 presents the shots-to-failure of the various treatments shown as a percent of the shots-to-failure of the P20 runners. From this box plot it can be seen that the variation within a treatment is greater than the difference between some treatments. Further, it can be seen that the H13 runners exhibited more shots to failure than all other treatments.
 Figure 3. Performance of runner bar treatments. Average life of P20 is equal to 100%.
From the mean results for each treatment, it appears that all samples of TDC, hard chrome and electroless nickel had greater mean shots-to-failure than P20. Additionally, one XADC sample had a greater mean than P20. However, due to the amount of variance between the replicates, the differences between the means may not be statistically significant. In order to determine statistical differences between the treatments, the results of the LSD analysis shown in Table 1 were used.
| Treatment | Replicate | Member of Group |
|---|---|---|
| Uncoated c17200 | 1 | a |
| TiN c18000 | 2 | a |
| TiN c17510 | 2 | a |
| XADC c17510 | 1 | a |
| TiN c18000 | 1 | a |
| TiN c17200 | 1 | ab |
| Uncoated c17510 | 1 | ab |
| TiN c17200 | 2 | ab |
| TiN c17510 | 1 | abc |
| Chrome c17200 | 2 | abc |
| Uncoated c17510 | 2 | abc |
| Uncoated c18000 | 1 | abcd |
| XADC c18000 | 1 | abcd |
| Uncoated P20 | 1 | abcd |
| XADC c17510 | 2 | bcde |
| XADC c18000 | 2 | bcdef |
| Uncoated c18000 | 2 | cdef |
| Chrome c18000 | 1 | cdef |
| XADC c17200 | 2 | defg |
| Uncoated c17200 | 2 | defg |
| TDC c18000 | 1 | defg |
| Chrome c17510 | 2 | defg |
| XADC c17200 | 1 | defg |
| Eless Nic c17200 | 1 | efgh |
| TDC c17200 | 1 | fghi |
| Uncoated P20 | 2 | fgh |
| Eless Nic c17510 | 1 | ghij |
| TDC c18000 | 2 | hijk |
| Chrome c17200 | 1 | ijk |
| TDC c17510 | 1 | jk |
| TDC c17200 | 2 | k |
| Chrome c17510 | 1 | l |
| Eless Nic c18000 | 1 | l |
| Eless Nic c17200 | 2 | l |
| Eless Nic c18000 | 2 | m |
| Eless Nic c17510 | 2 | m |
| TDC c17510 | 2 | n |
| Uncoated H13 | 1 | o |
| Chrome c18000 | 2 | p |
| Uncoated H13 | 2 | q |
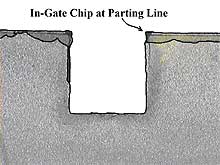 Figure 4 . Chrome chipping in the gate.
The results of the LSD analysis revealed that four samples of electroless nickel plated runners were statistically different (p < .05) from the best performing P20 runner and had superior wear resistance. Three samples each of TDC and hard chrome plated runner performed likewise. H13 was the best performer in the data as it was grouped individually and had no overlap with other treatment as shown in Figure 3.
The early failures of chrome platings were found to have come from chipping failures. From the images obtained from the Nikon Video Measurescope, the typical appearance of a chipping failure can be seen ( Figure 4 ). These failures often began at sharp edges and would extend down flat surfaces.
The images from the Nikon Measurescope revealed deposition nodules left in the runner system during the TiN process ( Figure 5 ). These nodules would break free from the runner bar and leave exposed copper alloy. Notice also from Figure 3 that this coating material failed quickly.
At the parting line of all coated and uncoated runner bars with the exception of H13, an aggressive wear phenomenon was observed ( Figure 6 ). The sharp edge of the intersection of the runner and the parting line runners would deform into the shape of a chamfer. This deformation would cause the coating or plating on the runner to crack and flake off.
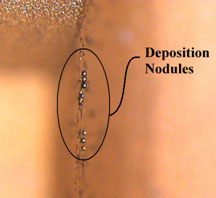 Figure 5 . TiN deposition nodules on the runner.
 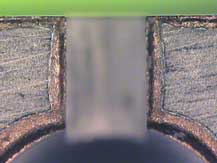 Figure 6 . Parting line deformation phenomenon in the gate area.
Conclusions
Due to the duration of the study and limitations on the number of replicates, the variation with treatments could not be reduced and further statistical differences could not be resolved. However, the numerical results taken in combination with the results of the statistical analysis suggest that the application of electroless nickel, TDC and hard chrome platings on copper alloy runners will result in the best protection of the intended gate geometry as compared to uncoated copper alloys or P20.
However, certain precautions should be taken to assure the correct application of chrome platings. It was shown that chrome plating had a tendency to chip off sharp edges and expose the underlying material. Molds that avoid sharp edges should avoid rapid failure in chrome plating. It is interesting to note that during plating preparation, the TDC plated runner bar had been chemically etched. These runners had slightly greater radii on sharp edges. These bars also exhibited a greater mean shots-to-failure than the other chromes.
On the titanium nitride coated runners, the deposition nodules were a source of rapid coating failure. These small nodules were quickly stripped from the runners and exposed the base material. Because of the rapid failure of this coating in the gates, TiN is not recommended.
One interesting phenomenon observed but not resolved was the deformation of the parting lines of most of the runner bars. This deformation appeared to have the visual characteristics of erosion, but it was not apparent how a flow of abrasive could exit the runner at these locations. Further investigations are ongoing into this phenomenon and will be reported when complete.
Acknowledgements
The authors extend their thanks to the Copper Development Association Inc. for providing necessary support for this research. Performance Alloys & Services Inc. and Johnson Precision Mold and Engineering constructed mold components. Ampco Metals Inc., BrushWellman Inc., Copper and Brass Sales, and NGK Metals provided mold alloys. Armoloy of Illinois, Hale Chrome Service and Balzers, Inc. provided the platings. Honeywell provided the nylon 6. The WMU Tribology Lab and Dr. Harold Michels of the Copper Development Association Inc provided research assistance.
Each of the following students contributed to the completion of this research: Ryan Brill, Jared Patterson, Troy Winningham, Rich Brothers, Adrian Sultana, Frank Asher, Mike Buckle, Jeff Lewis, Marshall Proulx, Jen VanOver, Leonid Fedorovitch, Machala Matt, Kenny Smith-Wedel, Damian Garland, Mike Westra, Dashia Bowens, Meghann Dickinson, Robert Smith, Jason Worrall, and Deb Wilde.

References
- Engelmann, P., Dawkins, E., Dealey, R., & Monfore, M. (1998). Getting heat out of the mold where water won't go. Technical Papers, vol. 44, pp. 836-840, Brookfield, CT: Society of Plastics Engineers.
- Engelmann, P., Dawkins, E., Dealey, R., & Monfore, M. (1999). Maintaining the thermal balance core to cavity: The key to cooling efficiency. Technical Papers, vol. 45, pp. 1048-1052, Brookfield, CT: SPE.
- Engelmann, P., Hayden, K., Guichelaar P., Monfore, M. & Dealey, R. (2001). Injection molding wear mechanisms and mold design. Plastics Engineering, vol. 571, no. 4, pp. 40-46, Brookfield, CT: SPE.
- Engelmann, P., Hayden, K., Guichelaar P., Monfore, M. & Dealey, R. (2001). Comparison of various hard coatings to protect copper mold components from erosive wear. Technical Papers, vol. 47, pp. 986-990, Brookfield, CT: SPE
- StatSoft, Inc. (1998). STATISTICA for Windows [Release 5.1 J]. Tulsa, OK.